Code
library(ggplot2)
library(pwr)
library(patchwork)library(ggplot2)
library(pwr)
library(patchwork)# range of correlations
r <- seq(.02, .1, .001)
nr <- length(r)
# range of Cohen's d
d <- seq(.02, 0.2, length.out = nr) # Adjusted range for Cohen's d
nd <- length(d)
# power values
p <- c(.80, .99)
np <- length(p)# obtain sample sizes for Pearson's correlation coefficient
samsize_r <- array(numeric(nr*np), dim=c(nr,np))
for (i in 1:np){
for (j in 1:nr){
result <- pwr.r.test(n = NULL, r = r[j],
sig.level = .05, power = p[i],
alternative = "two.sided")
samsize_r[j,i] <- ceiling(result$n)
}
}
# obtain sample sizes for Cohen's d
samsize_d <- array(numeric(nd*np), dim=c(nd,np))
for (i in 1:np){
for (j in 1:nd){
result <- pwr.t.test(n = NULL, d = d[j],
sig.level = .05, power = p[i],
alternative = "two.sided")
samsize_d[j,i] <- ceiling(result$n)
}
}# create dataframe for ggplot for Pearson's correlation coefficient
df_r <- data.frame(r = rep(r, np), samsize = c(samsize_r[,1], samsize_r[,2]),
power = rep(p, each = nr), measure = "Pearson's r")
# create dataframe for ggplot for Cohen's d
df_d <- data.frame(d = rep(d, np), samsize = c(samsize_d[,1], samsize_d[,2]),
power = rep(p, each = nd), measure = "Cohen's d")
# Rename columns in df_d to match df_r
names(df_d) <- c("r", "samsize", "power", "measure")
# Combine data frames
df_combined <- rbind(df_r, df_d)# Define Hufflepuff colors
hufflepuff_colors <- c("#FFDD00", "#000000")
# Plot for Pearson's correlation coefficient
plot_r <- ggplot(df_r, aes(x = r, y = samsize, color = factor(power))) +
geom_line(linewidth = 1) +
scale_color_manual(values = hufflepuff_colors) +
labs(x = "Correlation Coefficient |r|",
y = "Sample Size (n)",
color = "Power",
title = "Power as a Function of Sample Size for r") +
theme_minimal() +
geom_hline(yintercept = 11865, linetype = "dashed", color = "black") +
scale_y_continuous(breaks = seq(0, 45000, by = 2500)) +
scale_x_continuous(breaks = seq(0, 0.1, by = 0.01)) + # Adjusted x-axis breaks
theme(legend.position = "none", text = element_text(size = 16)) # Adjust font size here# Plot for Cohen's d
plot_d <- ggplot(df_d, aes(x = r, y = samsize, color = factor(power))) +
geom_line(linewidth = 1) +
scale_color_manual(values = hufflepuff_colors) +
labs(x = "Cohen's d",
y = "Sample Size (n)",
color = "Power",
title = "Power as a Function of Sample Size for Cohen's d") +
theme_minimal() +
geom_hline(yintercept = 11865, linetype = "dashed", color = "black") +
scale_y_continuous(breaks = seq(0, 100000, by = 5000)) +
scale_x_continuous(breaks = seq(0, .2, by = 0.05)) + # Adjusted x-axis breaks
theme(legend.position = "none", text = element_text(size = 16)) # Adjust font size here# Combine plots using patchwork
combined_plot <- plot_r + plot_d + plot_layout(ncol = 2)
# Add single legend at the bottom
combined_plot <- combined_plot + theme(legend.position = "right", text = element_text(size = 16))
# Display the combined plot
print(combined_plot)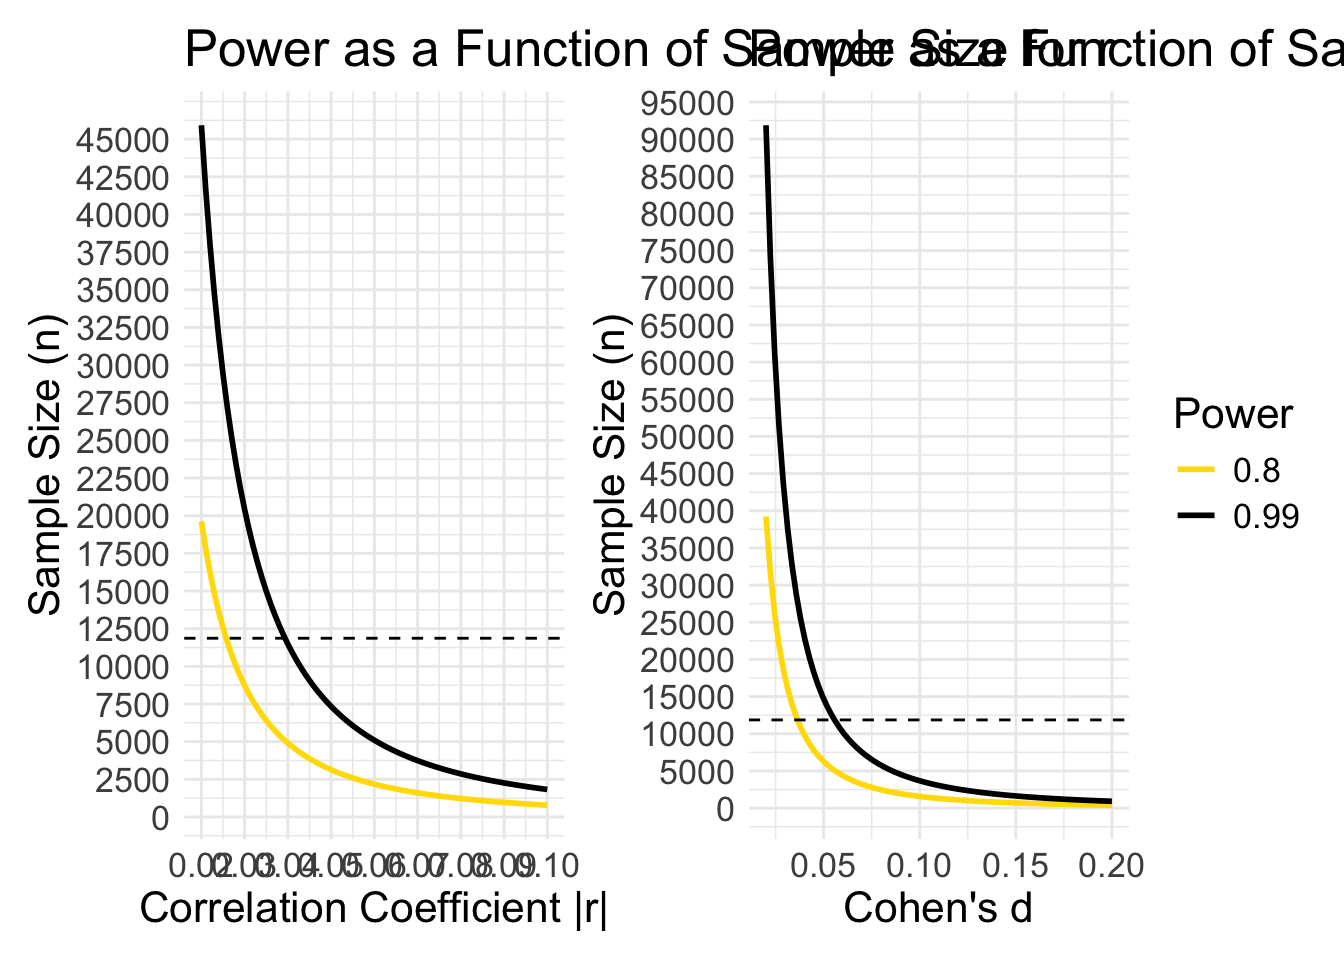
# Save the combined plot to a .tiff file with 600 dpi resolution
ggsave("combined_plot.tiff", plot = combined_plot, dpi = 600)
Saving 7 x 5 in image# Save the combined plot to a .eps file
ggsave("combined_plot.eps", plot = combined_plot, device = "eps")Saving 7 x 5 in image